

Do you take steps to measure the effectiveness of your marketing campaigns and whether they’re generating positive ROI? And, if so, how confident are you that you’re tracking the right metrics?
A recent study by Nielsen discovered that only 54% of marketers feel confident in the accuracy of their marketing ROI measurement. And yet, marketing budgets are on the rise as we fight to acquire and retain fitness customers with captivating campaigns across channels.
In this article, we’ll lay out seven key metrics that you should focus on to accurately gauge your marketing campaign performance and ROI. And we’ll let you in on three powerful strategies that you can use to boost your data analysis and insights.
But just one thing before we get started—why do you need to monitor marketing campaign performance in the first place?
The Importance of Monitoring Marketing Campaign Performance
Marketing is a delicate balance of anything-goes creativity and strategic, data-driven decision-making. While creating innovative, exciting marketing campaigns is at the core of your marketing activities, it’s critical to make sure that the campaigns you create are actually performing as you’d expect.
And by “as you’d expect”, we mean that they’re successfully attracting, engaging, and converting customers without having a negative effect on your ROI.
Beyond that, monitoring marketing metrics and performing data analysis helps you increase gym revenue and profits by replicating campaign success. It not only tells you what worked well and what didn’t, but it gives you invaluable insight into why they performed as they did.
Backed up by data, you can make improvements to continuously optimize fitness marketing campaigns.

7 Key Metrics for Monitoring Marketing Campaign ROI
So, which metrics should you track? Here are our picks of the top marketing metrics for monitoring campaigns.
Return On Investment (ROI)
Marketing ROI is a key metric that measures the profitability of your marketing campaigns. Specifically, it tells you how much revenue you’ve made from the campaign compared to how much you spent on it.
Marketing ROI = (Total revenue – Marketing costs / Marketing costs) x100
Let’s say you accumulated $1000 of revenue from a digital ad campaign that you spent $400 on. Your calculation would look like this:
1000 – 400 = 600
600 / 400 = 1.5
1.5 x 100 = 150
So, your ROI would be 150%.
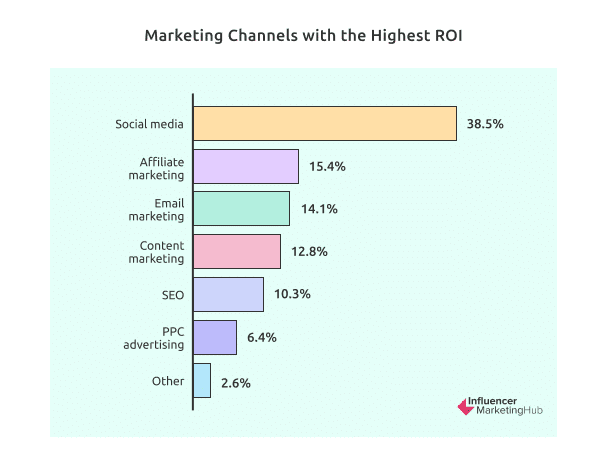
Some types of digital marketing channels routinely generate higher ROI than others. In a recent study, over 35% of businesses cited social media as having the highest ROI, followed by affiliate marketing, email marketing, and content marketing.
Calculating ROI confirms that you’re generating more money from your campaigns than you spend on them. You don’t even have to do the math yourself—online accounting software can do it for you, automating the process to prevent costly human errors and boost productivity.
Customer Acquisition Cost (CAC)
CAC measures how much it costs your company to acquire a new customer via marketing initiatives. Costs include all expenses related to your marketing and sales activities, such as salaries, advertising costs, agency costs, commissions, overheads, etc.
Customer acquisition cost = (Total cost of sales and marketing) / Number of customers acquired
The lower your CAC, the more cost-effectively your business gains new customers, which typically contributes to a higher marketing ROI.
Customer Lifetime Value (CLV)
CLV leverages historical and predictive data models to suggest how much revenue you can expect from individual customers (or groups of customers) throughout their entire relationship with your brand. To calculate this metric, you’ll need to work out your customer value, which is the average value of sales multiplied by the average number of transactions.
From there, you can use the following formula:
CLV = Customer value x Average customer lifespan
Using customer lifetime value, you can pinpoint customers that drive the most revenue to your business and target them with retention marketing campaigns to boost loyalty and, in turn, recurring revenue.
Not only that, but you can identify common characteristics of high-value customers to proactively and directly target new customers with high CLV potential.
By knowing what types of marketing content and messages members respond best to, you can optimize campaigns, reduce customer acquisition costs, accurately allocate marketing budgets, and prevent churn.
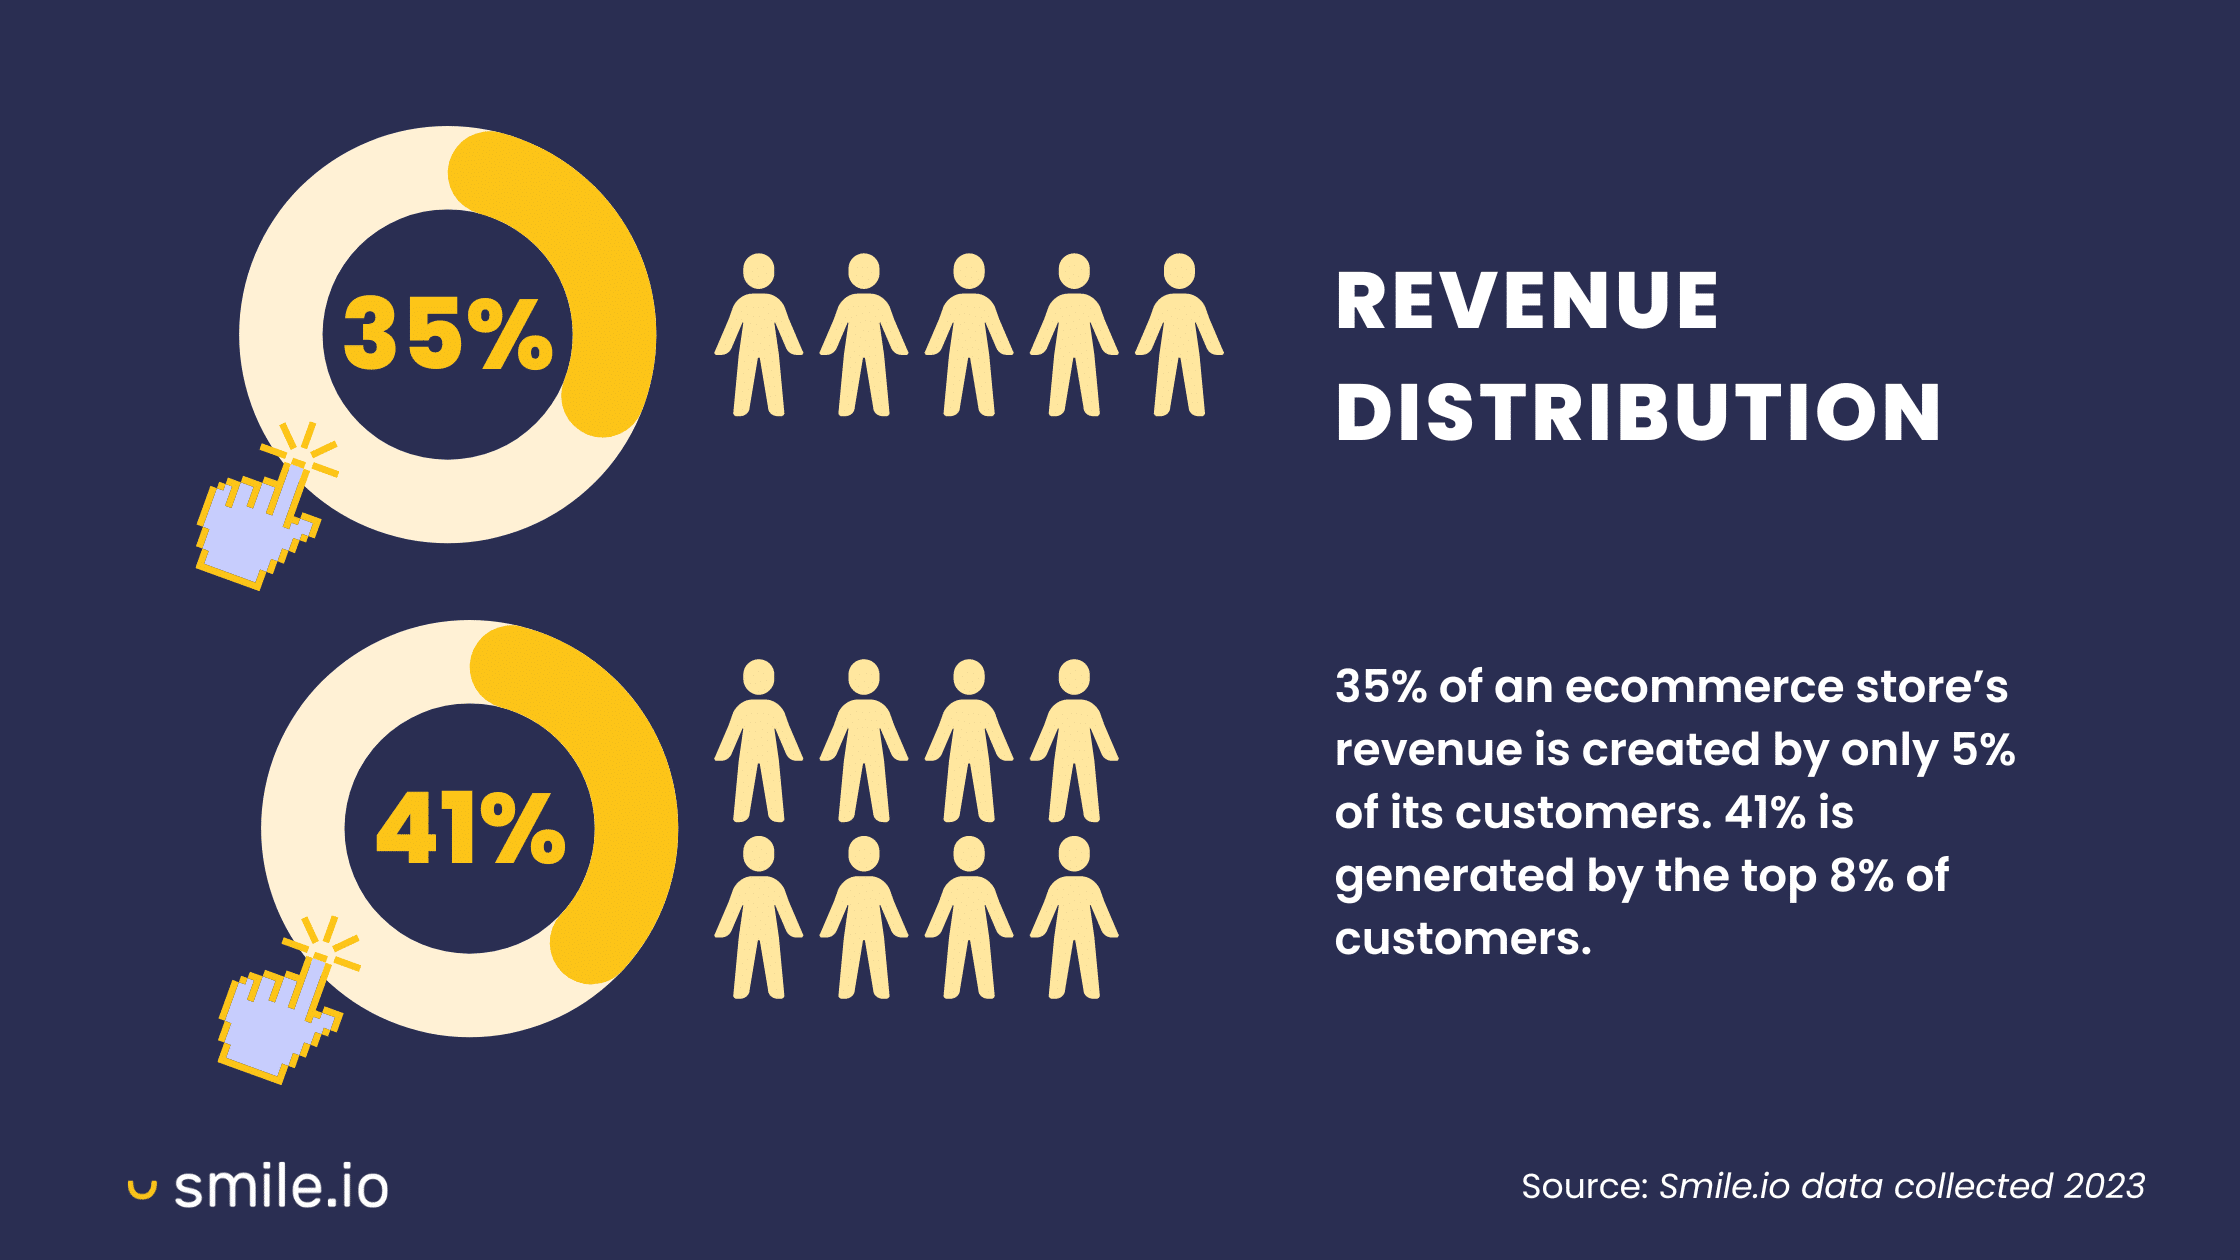
Remember, 41% of revenue is generated by the top 8% of customers. So, acquiring and retaining these customers should be a #1 marketing priority.
Conversion Rate
Conversion rate tracks the percentage of users who interact with your landing page, ad, email, etc, and go on to complete a desired action. Depending on your campaign, this could represent the number of customers who purchase a membership, enroll in a class, sign up to your email list, or download your ebook, for example.
Conversion rate = Total conversions / Total visitors
Conversion rates validate which campaigns successfully meet objectives, giving marketers insight into what type of campaigns resonate with customers. Using this knowledge, marketers can focus their resources on high-converting campaigns to optimize ROI.
Click-Through Rate (CTR)
Your click-through rate (CTR) measures the volume of clicks that you get on a specific piece of marketing material, such as a web page, advertisement, link, or email. This is in comparison to the number of impressions (i.e., how many users viewed the content but didn’t click through).
CTR = Clicks / Impressions
Measuring CTR gives you insight into whether the design, copy, and call-to-actions within your marketing content resonate with your target audience. When tracked alongside A/B testing (which is when you show two versions of content to customers and track which one receives the most clicks), you can optimize content in alignment with customer preferences.
Engagement Rate
Engagement rate measures how many people interact with specific pieces of content, such as your social media posts, blog content, and emails. There are lots of different types of interactions to track depending on the campaign, such as likes, shares, comments, and clicks.
Engagement rate = Total engagement / Total impressions or followers
Creating marketing content costs you a fair amount of resources. Engagement rates illuminate whether your content is actually providing value for your customers.
If users are actively liking, sharing, and commenting on your content, then it justifies the costs that you put into creating it. And it tells you what types of content your customers enjoy, which you can use to optimize strategies and increase ROI.
Cost Per Lead (CPL)
Cost per lead calculates how much it costs your marketing team to acquire a new lead. This is different from CAC, which measures the cost of acquiring paying customers.
CPL = Cost of lead generation / Total number of leads
Lead generation is the heartbeat of small businesses, fuelling growth and sustainability. But it can also eat away at your budget and decrease ROI. A high CPL, particularly when coupled with low conversions, indicates that you’re spending too much on lead generation activities that only drive low-quality leads.
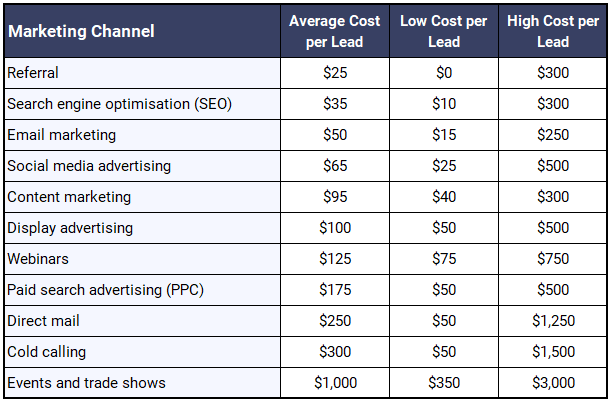
Average CPL varies depending on the channels you use. Referrals and SEO have the lowest CPL at $25 and $35 respectively, while cold calling and events have the highest.
Advanced strategies for comprehensive monitoring
What can you do to amplify your monitoring and improve the value of your insights?
Integrate metrics for holistic insights
Centralizing your marketing metrics onto one platform reduces data silos, giving everyone in your marketing team a complete, unified view of your marketing performance. And, with all of your metrics in one place, you can analyze the co-dependencies, relationships, and patterns that exist between metrics, offering nuanced, holistic insights into your marketing ROI.
To do this, leverage a data visualization tool with a customizable dashboard. It should offer integrated, high-level metric viewpoints complete with easy-to-interpret graphs, charts, and tables.
Utilize Marketing Automation Tools
With the vast amount of data your company generates, it’s impossible to manually collect, update, monitor, and analyze it without becoming overwhelmed.
Marketing automation tools automate data collection, monitoring, and reporting (along with a host of other repetitive tasks) to give you faster, clearer insights into your marketing performance.
The right marketing automation tool can scale success. 45% of businesses say that automation increases efficiency and marketing ROI. Other benefits include increased lead quality, conversions, and marketing/sales collaboration.
Leverage Data Analytics and AI
Data analytics and AI have been integrated into various types of marketing solutions to deepen your insights, streamline processes, and help you unlock new, innovative opportunities.
For example, AI can be leveraged to hyper-personalize customer experiences. Using machine learning and swift data analysis, AI can track customer interactions and past purchases to identify their preferences, motivations, and pain points.
Armed with this info, it can target customers with tailored product recommendations and customized discounts at exactly the right point in the customer journey.
Another useful application of data analytics is inventory management. Inventory management software not only monitors inventory in real-time, but it can leverage sophisticated data and analytics to predict future product demand. This means that you can optimize your inventory budget to reduce costly overstocks and understocks, allocating more resources toward marketing activities.
Final thoughts
The key metrics we’ve outlined in this article are some of the most critical for marketing campaign monitoring and analysis. They tell you whether your campaigns are attracting, engaging, and converting high-quality customers, and whether they’re generating sufficient revenue in alignment with your budget and goals.
And don’t forget to leverage AI, data analytics, visualization tools, and marketing automation to increase the value and accessibility of your metrics and insights.
Interested in getting more tips to grow your small business? Download our free Solutions Guide for Small Business Professionals today!